
Advanced Excel Training in Phagwara
Learn advanced Excel formulas, PivotTables, dashboards, data analysis and reporting with Advanced Excel Training at techcadd in Phagwara.
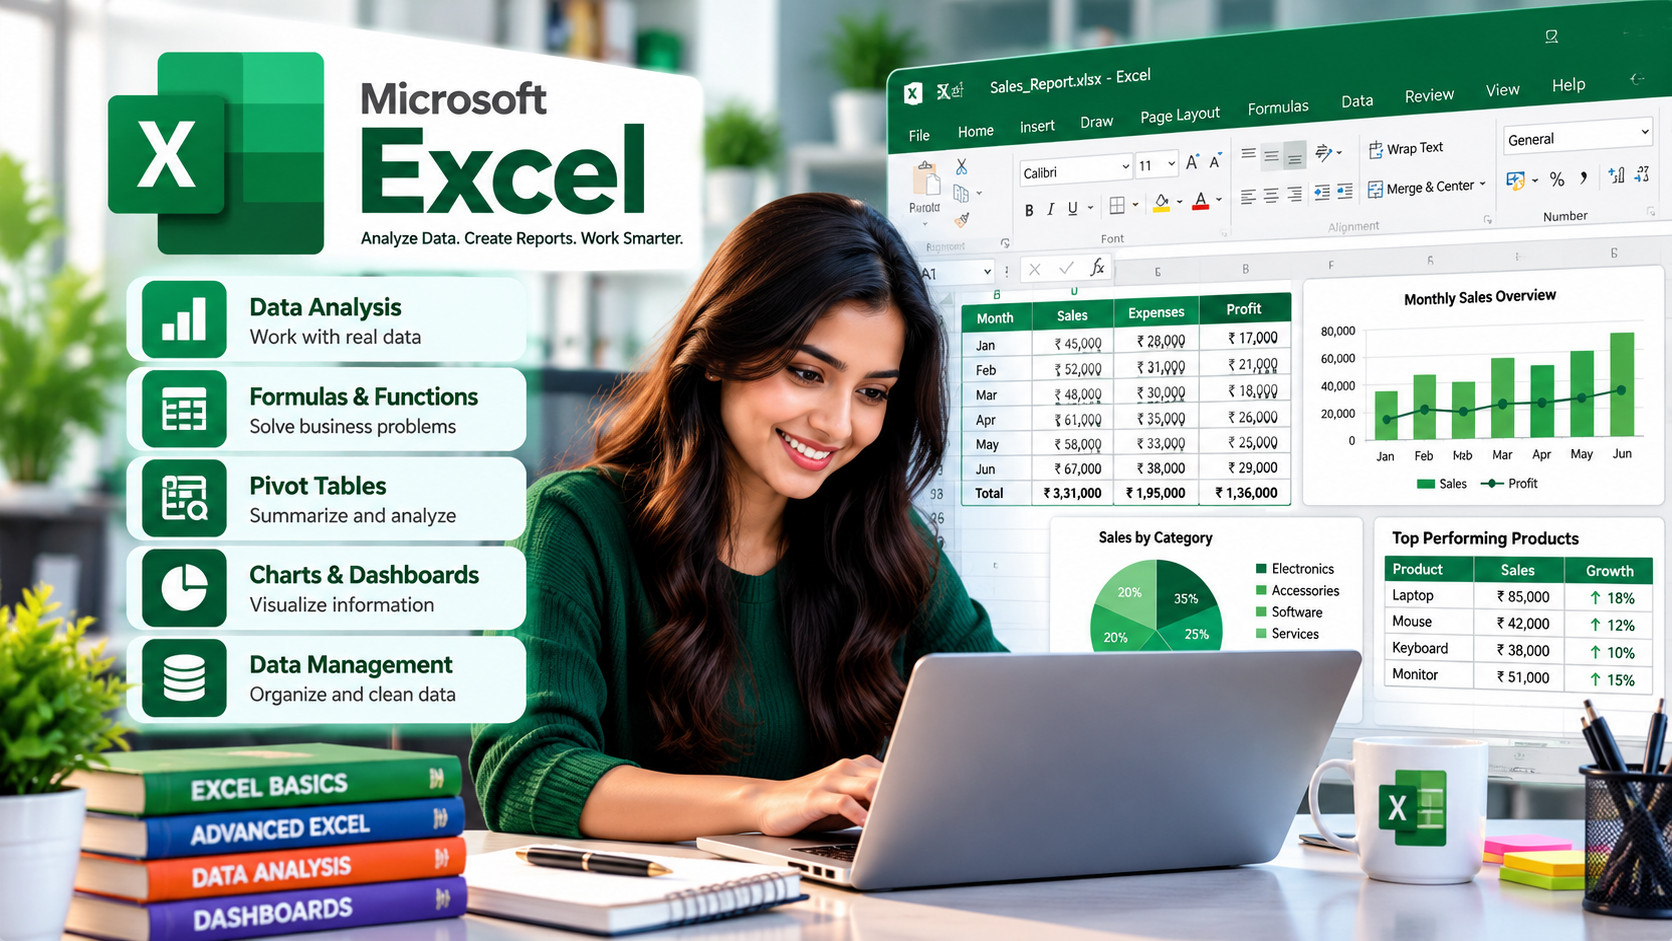
Advanced Excel Training in Phagwara
Introduction to Advanced Excel Training
Microsoft Excel is one of the most widely used spreadsheet applications for data management, calculations, reporting, and business analysis. Advanced Excel skills help students and professionals organize large amounts of data, automate repetitive tasks, prepare reports, and make informed decisions.
techcadd offers Advanced Excel Training in Phagwara for learners who want to improve their spreadsheet knowledge and develop practical data-handling skills. The training focuses on advanced formulas, functions, data analysis, PivotTables, charts, dashboards, and professional reporting techniques.
Whether you are a student, job seeker, working professional, accountant, or business owner, learning Advanced Excel can help you perform everyday tasks more efficiently and improve your productivity.
What Is Advanced Excel Training?
Advanced Excel Training helps learners move beyond basic spreadsheet operations and understand the tools used for complex calculations, data analysis, reporting, and automation. It covers techniques for processing data, identifying trends, creating summaries, and presenting information in a clear and organized format.
With practical exercises and real-world examples, learners can understand how Excel is used in office administration, finance, accounting, sales, inventory management, human resources, and business operations.
What You Will Learn in Advanced Excel Training
1. Advanced Excel Formulas and Functions
Learn how to use advanced formulas and functions to perform calculations and analyze data. Understand functions such as IF, IFS, SUMIF, SUMIFS, COUNTIF, COUNTIFS, IFERROR, and nested formulas. These functions help simplify calculations and improve accuracy when working with large spreadsheets.
2. Lookup Functions
Understand how to retrieve information from tables and datasets using VLOOKUP, HLOOKUP, XLOOKUP, and INDEX-MATCH. Learn how lookup functions can connect related data, search for specific values, and reduce manual work in reports.
3. Data Sorting and Filtering
Learn how to organize large datasets using sorting, filters, advanced filters, and custom sorting options. Understand how to identify specific records, remove duplicate entries, and arrange information for easier analysis.
4. PivotTables and PivotCharts
Learn how to summarize and analyze large amounts of information using PivotTables and PivotCharts. Understand how to group records, compare categories, calculate totals, and create interactive summaries for business reporting.
5. Conditional Formatting
Discover how to highlight important information automatically using conditional formatting. Learn to identify duplicate values, highlight top and bottom performers, apply colour scales, and recognize trends or unusual values within datasets.
6. Data Validation and Drop-Down Lists
Learn how to control data entry using data validation rules, drop-down lists, date restrictions, and numeric limits. These techniques help maintain consistent information and reduce errors when multiple people work with the same spreadsheet.
7. Charts, Graphs, and Data Visualization
Learn how to create professional charts and graphs to present data effectively. Understand column charts, bar charts, line charts, pie charts, and combination charts, and learn how to choose suitable visualizations for different reporting requirements.
8. Advanced Data Analysis Tools
Explore tools such as What-If Analysis, Goal Seek, Scenario Manager, and data tables. Understand how these features help compare alternatives, evaluate assumptions, and support decision-making using spreadsheet models.
9. Excel Dashboards and MIS Reports
Learn how to combine formulas, charts, PivotTables, and formatting techniques to prepare informative dashboards and Management Information System (MIS) reports. Understand how to display important metrics, compare performance, and present business information in a structured format.
10. Text, Date, and Logical Functions
Work with text functions such as LEFT, RIGHT, MID, LEN, TRIM, TEXT, and CONCAT. Learn to use date and time functions, logical conditions, and error-handling techniques to clean, transform, and analyze spreadsheet data.
11. Data Cleaning and Preparation
Learn how to organize raw data, remove duplicates, correct inconsistencies, handle missing information, and prepare datasets for analysis. Understand the importance of clean and structured data for producing accurate reports.
12. Introduction to Excel Automation
Understand how Excel automation can reduce repetitive work. Explore recorded macros and learn about the role of VBA in automating spreadsheet tasks, where included in the training. Discover how automation can improve efficiency when generating recurring reports and performing routine calculations.
Benefits of Advanced Excel Training
Advanced Excel skills can help learners improve their productivity, accuracy, and confidence when working with business data.
Perform complex calculations using advanced formulas.
Analyze large datasets efficiently.
Create professional charts, dashboards, and reports.
Reduce manual work through formulas and automation.
Improve data accuracy and consistency.
Prepare summaries for management and business decisions.
Develop practical spreadsheet skills relevant to office-based roles.
Improve readiness for Excel-based assessments and workplace tasks.
Advanced Excel Training in Phagwara
Introduction to Advanced Excel Training
Microsoft Excel is one of the most widely used spreadsheet applications for data management, calculations, reporting, and business analysis. Advanced Excel skills help students and professionals organize large amounts of data, automate repetitive tasks, prepare reports, and make informed decisions.
techcadd offers Advanced Excel Training in Phagwara for learners who want to improve their spreadsheet knowledge and develop practical data-handling skills. The training focuses on advanced formulas, functions, data analysis, PivotTables, charts, dashboards, and professional reporting techniques.
Whether you are a student, job seeker, working professional, accountant, or business owner, learning Advanced Excel can help you perform everyday tasks more efficiently and improve your productivity.
What Is Advanced Excel Training?
Advanced Excel Training helps learners move beyond basic spreadsheet operations and understand the tools used for complex calculations, data analysis, reporting, and automation. It covers techniques for processing data, identifying trends, creating summaries, and presenting information in a clear and organized format.
With practical exercises and real-world examples, learners can understand how Excel is used in office administration, finance, accounting, sales, inventory management, human resources, and business operations.
What You Will Learn in Advanced Excel Training
1. Advanced Excel Formulas and Functions
Learn how to use advanced formulas and functions to perform calculations and analyze data. Understand functions such as IF, IFS, SUMIF, SUMIFS, COUNTIF, COUNTIFS, IFERROR, and nested formulas. These functions help simplify calculations and improve accuracy when working with large spreadsheets.
2. Lookup Functions
Understand how to retrieve information from tables and datasets using VLOOKUP, HLOOKUP, XLOOKUP, and INDEX-MATCH. Learn how lookup functions can connect related data, search for specific values, and reduce manual work in reports.
3. Data Sorting and Filtering
Learn how to organize large datasets using sorting, filters, advanced filters, and custom sorting options. Understand how to identify specific records, remove duplicate entries, and arrange information for easier analysis.
4. PivotTables and PivotCharts
Learn how to summarize and analyze large amounts of information using PivotTables and PivotCharts. Understand how to group records, compare categories, calculate totals, and create interactive summaries for business reporting.
5. Conditional Formatting
Discover how to highlight important information automatically using conditional formatting. Learn to identify duplicate values, highlight top and bottom performers, apply colour scales, and recognize trends or unusual values within datasets.
6. Data Validation and Drop-Down Lists
Learn how to control data entry using data validation rules, drop-down lists, date restrictions, and numeric limits. These techniques help maintain consistent information and reduce errors when multiple people work with the same spreadsheet.
7. Charts, Graphs, and Data Visualization
Learn how to create professional charts and graphs to present data effectively. Understand column charts, bar charts, line charts, pie charts, and combination charts, and learn how to choose suitable visualizations for different reporting requirements.
8. Advanced Data Analysis Tools
Explore tools such as What-If Analysis, Goal Seek, Scenario Manager, and data tables. Understand how these features help compare alternatives, evaluate assumptions, and support decision-making using spreadsheet models.
9. Excel Dashboards and MIS Reports
Learn how to combine formulas, charts, PivotTables, and formatting techniques to prepare informative dashboards and Management Information System (MIS) reports. Understand how to display important metrics, compare performance, and present business information in a structured format.
10. Text, Date, and Logical Functions
Work with text functions such as LEFT, RIGHT, MID, LEN, TRIM, TEXT, and CONCAT. Learn to use date and time functions, logical conditions, and error-handling techniques to clean, transform, and analyze spreadsheet data.
11. Data Cleaning and Preparation
Learn how to organize raw data, remove duplicates, correct inconsistencies, handle missing information, and prepare datasets for analysis. Understand the importance of clean and structured data for producing accurate reports.
12. Introduction to Excel Automation
Understand how Excel automation can reduce repetitive work. Explore recorded macros and learn about the role of VBA in automating spreadsheet tasks, where included in the training. Discover how automation can improve efficiency when generating recurring reports and performing routine calculations.
Benefits of Advanced Excel Training
Advanced Excel skills can help learners improve their productivity, accuracy, and confidence when working with business data.
Perform complex calculations using advanced formulas.
Analyze large datasets efficiently.
Create professional charts, dashboards, and reports.
Reduce manual work through formulas and automation.
Improve data accuracy and consistency.
Prepare summaries for management and business decisions.
Develop practical spreadsheet skills relevant to office-based roles.
Improve readiness for Excel-based assessments and workplace tasks.