

Excel Business Analysis Project
Build a complete Excel analysis from scratch: organise business data, use formulas and functions, create Pivot Tables, analyse KPIs and produce a report someone can use.
- Excel
- Pivot Tables
Turn numbers into decisions — Excel, SQL, Python, Power BI and Tableau, with dashboards, live projects and placement assistance.
25,000+
Students trained
since 2007
4.9★
Google rating
556+ reviews
100%
Practical training
live client work
Techcadd’s Data Analytics Programming Course in Phagwara is an industry-focused programme for students, graduates, job aspirants, entrepreneurs, business owners and aspiring analysts who want practical analytical skill. It covers Excel, SQL, Python, data cleaning, visualisation, Power BI, Tableau, business reporting, statistics, dashboard creation and AI-powered analytics tools. The training is hands-on throughout — real datasets, practical projects and industry-standard tooling — so you learn to collect, clean, organise, analyse, visualise and interpret data into insight that supports a decision. Unlike purely theoretical learning, you work with real datasets, reporting workflows, dashboard development and business intelligence technique, and finish understanding how organisations use data to spot trends, measure performance and decide well.

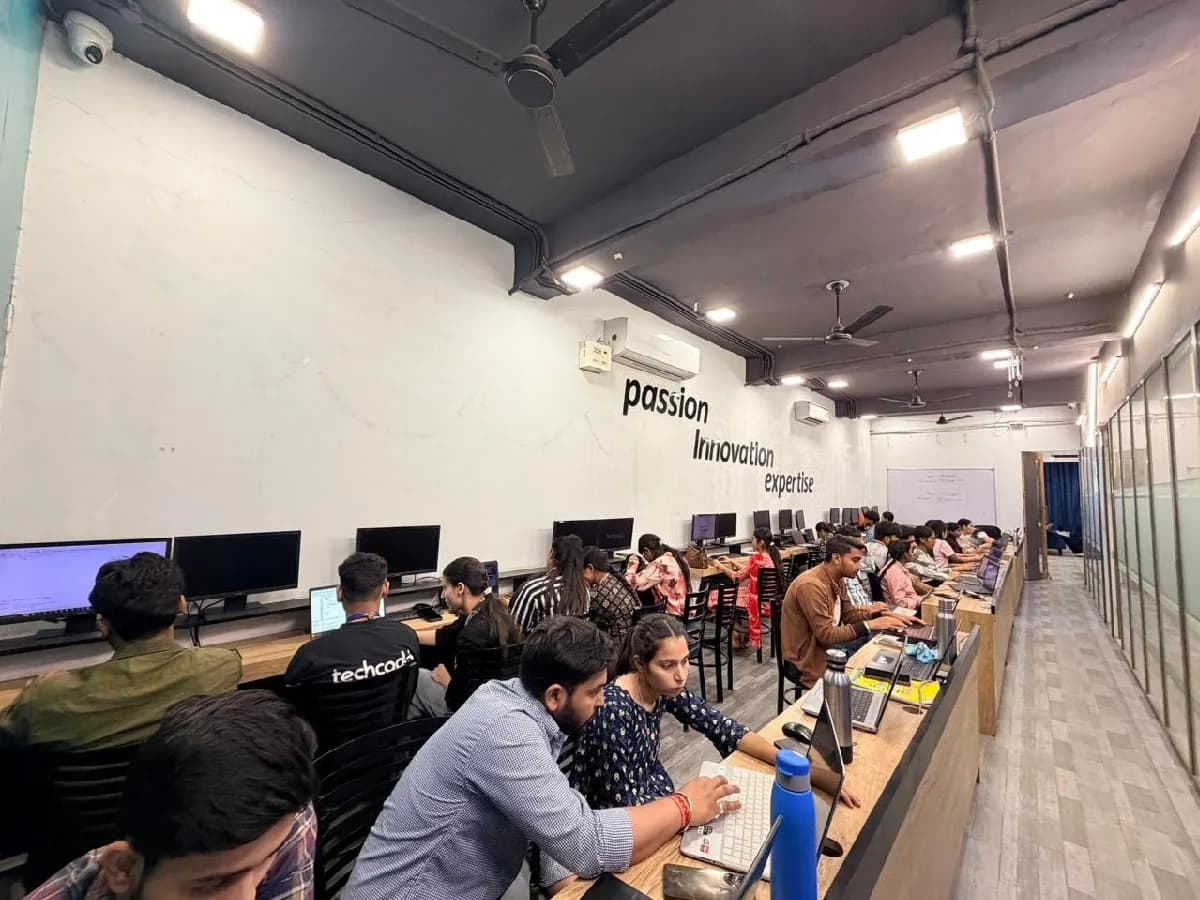
The Data Analytics course is built for people at six different starting points, and the batch is deliberately mixed. What matters far more than your background is turning up consistently and finishing what each module asks you to build.
You do not need previous technical experience to understand how businesses use data. A structured course covers Excel, basic SQL, Python fundamentals, cleaning, charts and dashboards — a smart way to explore business analytics alongside your studies.
Employers value academic knowledge combined with practical analytical skill. Whatever you study — commerce, management, arts, computer science, engineering or mathematics — analytics shows you how information becomes insight.
Learning several tools alone is confusing. A structured path replaces certificate-collecting with understanding how real projects run: cleaning raw data, writing queries, building dashboards, analysing trends and presenting business insight.
Already in IT, finance, sales, marketing, operations or management? Analytics makes your experience more valuable. Sales professionals learn to analyse performance; business professionals learn how dashboards support decisions.
You do not have to become an analyst. Understanding your own sales trends, customer behaviour, marketing performance and operational data makes you a better decision-maker — and easier for analysts and agencies to work with.
Excel reporting, SQL analysis, Power BI and Tableau dashboards, visualisation, business reporting and performance analytics are all billable — and dashboards are among the easiest deliverables to sell.
Excel and a dashboard is the most immediately hireable data skill in Punjab — every firm with sales figures needs someone to read them, long before it needs anyone who can train a model. That gap is the whole argument for this course: there is local demand, there are budgets, and there are very few trained people to hand the work to.

Build skills that hold up beyond the classroom.
What separates this from a playlist of tutorials is supervision on real work. From the second half of the course you build on live client projects with a trainer beside you, make decisions that have consequences, and correct them the following week. That loop is the skill. No employer in Phagwara will take your word for it without work they can inspect.
Be realistic about the money. A fresher who finishes with a working portfolio starts near the bottom of the band and moves quickly; someone who finishes with a certificate and nothing to show does not. The difference is entirely what you built.
The alternative is what most people try first: free videos, a cheap online course, six months of drifting, and knowledge you cannot demonstrate. A structured programme with live projects, a mentor who corrects you, an internship letter and a placement cell that actually calls employers is the difference between knowing the subject and being hired to do it.
Students reach the Phagwara centre from Banga, Nakodar, Kartarpur and the university belt, and the weekend batch exists so a job or a degree does not have to be paused to attend.
IT companies, e-commerce brands, hospitals, financial organisations, manufacturers, education companies and local service providers all use data to measure performance. Excel, SQL, Python, Power BI, Tableau, visualisation and BI apply across all of them.
Creating a chart is the beginning. Data collection and organisation, Excel formulas, cleaning, SQL, database fundamentals, Python, exploratory analysis, statistics, visualisation, dashboards, BI and storytelling are the rest.
Tutorials teach you where the buttons are. Practical training teaches you to solve problems — cleaning, Excel analysis, SQL queries, Python, dashboards, Power BI reporting, Tableau and business analysis.
Creating reports is easy; finding the right insight is the challenge. You learn to read revenue, growth rate, conversion, customer trends, averages, percentages, KPIs and correlations well enough to know whether the data tells a useful story.
AI is changing how analysts clean data, write queries and build dashboards. But it does not replace analytical thinking: the business problem, data quality, KPIs, trends and context still need a person who understands them.
The syllabus is arranged so every module produces an asset rather than a set of notes. You will cover excel & data analytics foundations, data cleaning & preparation, sql & database analytics, python for data analytics, and finish with a live project built on Microsoft Excel, Advanced Excel, SQL. Modules run in the order a real project runs: foundations first, then the core skills, then applied work under supervision, then the portfolio and interview preparation that turn all of it into an offer letter.
The working knowledge the job description actually lists.
SQL & Database Analytics
Learn to retrieve and analyse information where business data actually lives.
3 weeks · 12 sessions
Python for Data Analytics
Learn how Python takes over when the dataset outgrows a spreadsheet.
3 weeks · 12 sessions
Data Visualisation & Dashboarding
Learn to turn raw numbers into a visual story someone can act on.
3 weeks · 12 sessions
Topics covered
The Data Analytics course runs as three nested levels. Each one builds on the last, so you can start at the foundation and continue later without repeating anything.
Understand how business information is organised and analysed — Excel, data cleaning, basic SQL, visualisation and reporting.
What it covers
+ 2 more
Skills & tools
Recommended for
Data Analyst Trainee, MIS Trainee, Reporting Intern and junior analytics roles.
Practical skill in SQL, Python, Power BI, Tableau, dashboards and business reporting — the level professional analytics roles want.
What it covers
+ 4 more
Skills & tools
Recommended for
Data Analyst, MIS Analyst, Reporting Analyst, Business Analyst, Power BI Developer and BI Analyst roles.
Advanced analytics with business intelligence, dashboard development, Python, advanced visualisation, reporting automation and AI-powered strategy.
What it covers
+ 6 more
Skills & tools
Recommended for
Senior Data Analyst pathway, Business Intelligence Analyst, Power BI Developer, Reporting Specialist, Business Analyst and advanced analytics pathways.
Excel fundamentals
Data cleaning
Pivot Tables & reports
Basic visualisation
SQL fundamentals
Advanced SQL
Python for analytics
Power BI
Tableau
Dashboard development
Advanced Power BI & DAX
Advanced Tableau
Data modelling
Reporting automation
AI & prompt engineering
The programme is nested, not parallel. The 3-month track gives you the essential foundation. The 6-month course includes those fundamentals and continues into professional SQL, Python, Power BI, Tableau, dashboards and reporting. The 9-month programme combines all of it with advanced business intelligence, data modelling, reporting automation, AI tools and end-to-end projects — so moving to a longer duration never means starting from zero.
The toolchain behind the craft
Everything below is installed on the lab machines and used on live client work, not shown once in a slide and forgotten.
Complete the course with a portfolio of live projects and receive an industry-recognised certificate, plus a documented internship letter accepted by Punjab universities.
Recognised by employers across Punjab and beyond
Based on real client work, not a simulation
Live work you can show in any interview
CV review, mock interviews and hiring drives
Two certificates on completion — the course certificate and a separate capstone project certificate.
The roles this opens, what they pay in Punjab and beyond, and who is hiring for them — drawn from published job-market listings on one comparable scale, not a brochure number.
Salary outlook
Turns business data into the reports and dashboards decisions get made from. Earnings vary with your skills, project experience, portfolio, certifications, company, location and performance.
Punjab — Data Analyst / BI
Delhi / NCR — Data Analytics / Business Intelligence
Remote / Freelance Data Analytics
Indicative ranges for Data Analyst roles, compiled from public job-market listings and drawn on the same scale in every market. Actual offers vary by employer, skillset and interview performance — Punjab pay typically reaches 2× the fresher ceiling within two years of delivery experience.
Talk about your target roleData Analyst, Business Analyst, MIS Executive, Reporting Analyst, Power BI Developer and BI Analyst. Practical project experience and the ability to explain an insight matter far more here than certificates.
A fresher with real project work starts around ₹18,000 – ₹30,000 a month in the Punjab market, rising to ₹30,000 – ₹50,000 with two years of experience. Delhi/NCR runs higher, and analysts who add Python and machine learning move well beyond it.
Yes, and analytics is one of the easiest skills to freelance with because a dashboard or report is a self-contained deliverable. Freelance income ramps rather than starting at a salary: around ₹10,000 – ₹25,000 a month early on, and ₹30,000 – ₹80,000+ once you have real client work behind you.
IT companies and software organisations, startups and SaaS companies focused on analytics, e-commerce and D2C brands studying sales and customers, and financial, healthcare and manufacturing organisations — plus remote and freelance clients.
Analytics is the faster route to a first job. It stays closer to Excel, SQL, dashboards and business questions, and those skills are hireable in months. Data Science goes further into Python, statistics and machine learning — it takes longer but reaches higher. Many people start here, get working, and move across later.
Build a complete Excel analysis from scratch: organise business data, use formulas and functions, create Pivot Tables, analyse KPIs and produce a report someone can use.
An analytics project answering real business questions in SQL — writing queries, filtering, joining, grouping and analysing datasets.
A complete Python project on practical datasets: clean the information, analyse trends, manipulate data and build useful visualisations.
Build an interactive dashboard on business performance — data models, KPIs, charts, filters and reports that make the trends obvious.
An analytical solution for a real business dataset: sales performance, customer behaviour, purchasing trends and the growth indicators that matter.
Turn a dataset into an interactive visual story with worksheets, dashboards, filters and charts that carry a business argument.
Use modern AI tools to accelerate cleaning, SQL, reporting, research and visualisation ideas — with accuracy, reasoning and originality kept central.
A complete solution for a real business problem: collection, cleaning, SQL analysis, visualisation, dashboard development, reporting and presentation.
The working loop
Every project moves through the same loop: understand the brief, build with guidance, then explain the decisions behind your work.
Start from a real business objective and work out what information answers it — the KPIs, the data sources, the customer trends and the performance metrics that matter.
Business Problem & Data Brief
Work with Excel, SQL, Python, Power BI, Tableau and dashboards under trainer guidance — clean the data, analyse it, build the report and develop the insight.
Data Analysis & Dashboard Development
Present findings, dashboards, KPIs, trends and recommendations like a professional, and learn to explain your analytical approach in an interview or client meeting.
End-to-End Data Analytics Project & Reporting
There are many places to learn this in Phagwara and the brochure syllabus looks similar at all of them. What differs is who teaches, whether you ever touch real work, and whether anyone picks up the phone after you have paid. techcadd has trained students across Punjab since 2007 on the same model: small batches, working practitioners as trainers, client projects as coursework.
The field keeps moving — AI, automation, BI platforms, cloud data tools and visualisation methods all change. Teaching uses practical examples and current approaches, so you understand not only how to build a report but why an insight matters.
Without practical work it is hard to understand a real business problem. Projects span Excel, SQL, Python, cleaning, Power BI dashboards, Tableau, KPI reporting, BI and AI-powered workflows.
A focused room means you can ask, discuss an analytical approach and get guidance while working on real datasets — whether you are a beginner or strengthening existing skill.
Finishing should mean more than a certificate. Practical exercises produce portfolio work demonstrating Excel, SQL, Python, Power BI, Tableau, visualisation, dashboards and reporting.
Resume improvement, interview preparation, portfolio presentation and mock interviews, with a realistic view of roles across analytics, BI, reporting and operations.
The goal is confidence understanding data, not memorising formulas or software interfaces — practical Excel, SQL, Python, Power BI, Tableau, visualisation, BI, KPI reporting and AI-powered analytics.
What made it click for me was the lab time. You can sit after class and someone will still explain it until you get it.
I travelled in for the weekend batch and it was worth every trip. Small batch, real work, no time wasted on theory nobody uses.
The course got me interview-ready faster than I expected. My interviewer asked to see my project and that was the whole conversation.
I was switching careers and worried I would be behind. Half the batch was doing the same thing, and nobody made it awkward.
I joined with almost no background and finished with a project I could actually show. The trainer never rushed the basics.
techcadd’s placement cell kept calling me for drives until I was placed. That persistence mattered more than anything else.
Choosing a Data Analytics course should be about more than a certificate. If the goal is a career, the things worth comparing are the coding practice, the projects, the trainer support and the skills you can actually apply.
Data Analytics curriculum
techcadd
Industry-focused training covering Excel, SQL, Python, Power BI, Tableau, dashboards and reporting
Commonly offered
Often focuses mainly on basic tool concepts
Learning style
techcadd
Hands-on and practical, designed around real datasets
Commonly offered
Can be more theory-oriented
Practical project training
techcadd
Students learn data cleaning, analysis, visualisation, dashboarding and reporting
Commonly offered
Practical exposure may be limited
Analytics skills
techcadd
Covers Excel, SQL, Python, KPIs, reporting, dashboards and business intelligence
Commonly offered
May cover only selected tools
Business intelligence
techcadd
Focus on data models, dashboards, KPIs and performance insight
Commonly offered
BI training can vary
Visualisation & reporting
techcadd
Practical understanding of charts, dashboards, storytelling and business reports
Commonly offered
Visualisation may receive limited attention
Portfolio building
techcadd
Practical assignments and analytics projects that demonstrate real skill
Commonly offered
Portfolio development may receive less focus
Career support
techcadd
CV guidance, mock interviews, portfolio preparation and career-oriented support
Commonly offered
Career assistance can vary significantly
Doubt support
techcadd
Trainer guidance throughout the learning journey to clarify concepts
Commonly offered
Support may be limited to scheduled sessions
Certification
techcadd
Course completion certification combined with practical learning exposure
Commonly offered
Certification format and practical exposure can vary
The right-hand column represents common market patterns, not a claim about any specific institute. Before choosing a Data Analytics institute in Phagwara, ask what you will actually learn, whether you will work on practical projects, how trainers teach analysis, and what career support is included.
It is designed to help learners understand how business data is collected, cleaned, analysed, visualised and turned into insight. The focus is practical: Excel, SQL, Python, Power BI, Tableau, cleaning, dashboards, reporting and business intelligence — real analytical skill rather than software concepts.
One call with a counsellor is usually enough to find out. Book a free demo class and see the lab before you decide.

Send your question and a counsellor will call you back about batch timings, fees, EMI options, placement record, or whether this course fits your degree.